
 Australia
 Singapore
 Hong Kong
 Malaysia
 Philippines
 Thailand
 Indonesia
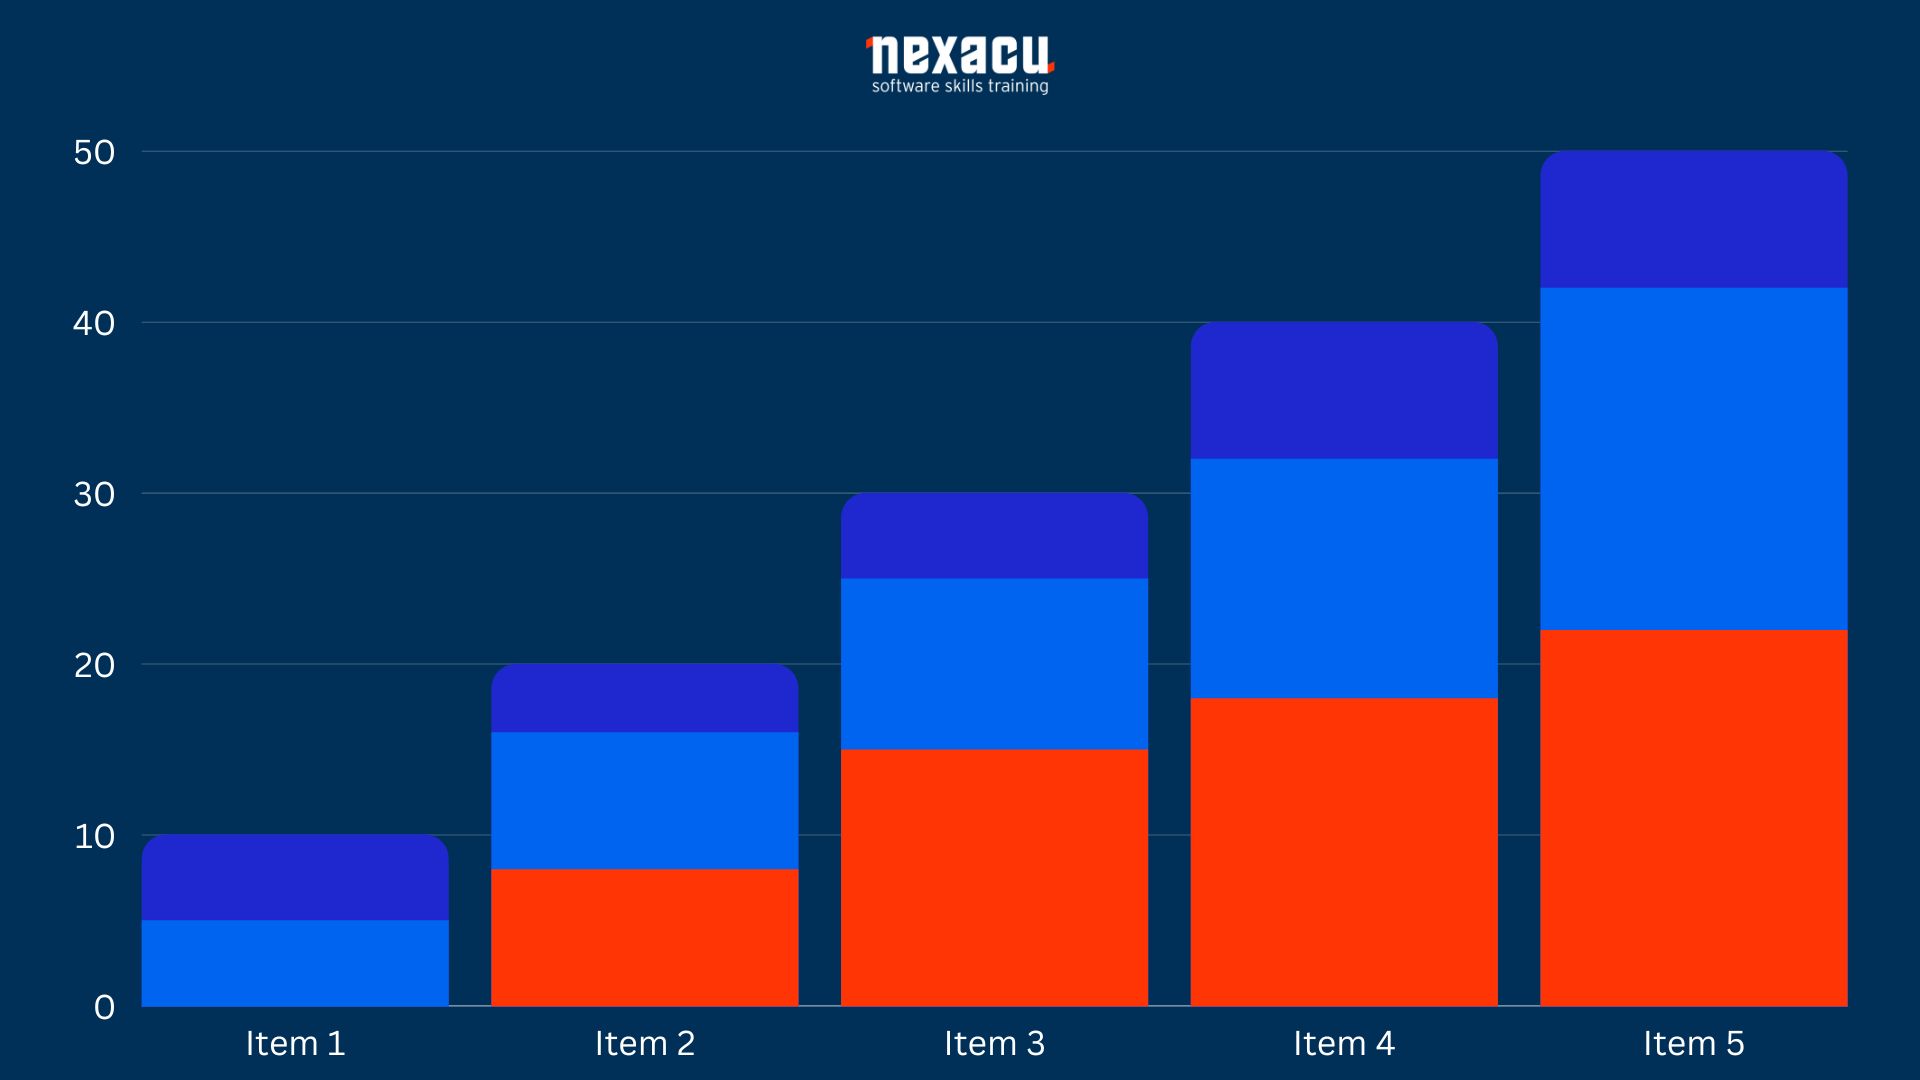
How to make a Bar Graph in R
When comparing data sets, bar graphs can be a great analysis tool to utilise. In this article, we will dive into exactly how to get started making bar graphs in R.
When comparing data sets, bar graphs can be a great analysis tool to utilise. In this article, we will dive into exactly how to get started making bar graphs in R.

Data Analytics is one of the most promising fields for job growth. Businesses worldwide will need to continue to increase their analytical capabilities to develop a competitive edge.
Is this your own project or part of a team? Are there many deliverables or very few? These are critical factors in determining the right task management software.

R is an open source and free programming language that was developed for statistical analysis and production of high-quality graphics. It has long been popular with statisticians and academics who make up part of the large active user community behind R.

The past decade has seen technology radically change almost every aspect of business management and development strategy. So it's crucial for companies looking to progress in 2020 to aim to be just as dynamic and adaptable as the technology they utilise. Making progress in the three key areas below will support you and your team in reaching your goals for 2020.


 phone
phone
 email
email
 enquiry